Ready to start your Bitcoin journey? Sign up for OKX, Binance, or Bitget today and take your first step into the world of cryptocurrency!
OKX:https://okx.com/join/8798539
Binance:https://accounts.binance.com/register?ref=1031203493
Candlestick charts are a fundamental tool for anyone venturing into the world of cryptocurrency trading. They offer a visual representation of price movements over a specific period, providing valuable insights into market sentiment and potential future price direction. This guide, inspired by comprehensive resources, will break down the anatomy of candlestick charts and teach you how to interpret their signals.
Why Candlestick Charts?
Compared to simple line charts, candlestick charts provide more detailed information about price action. Each candlestick represents the price movement during a chosen timeframe (e.g., 1 minute, 1 hour, 1 day). This granular view allows traders to identify patterns and make more informed decisions.
The Anatomy of a Candlestick
Each candlestick consists of three main parts:
The Body (Real Body): This is the thicker, rectangular part of the candlestick. It represents the price difference between the open and close prices during the specified timeframe.
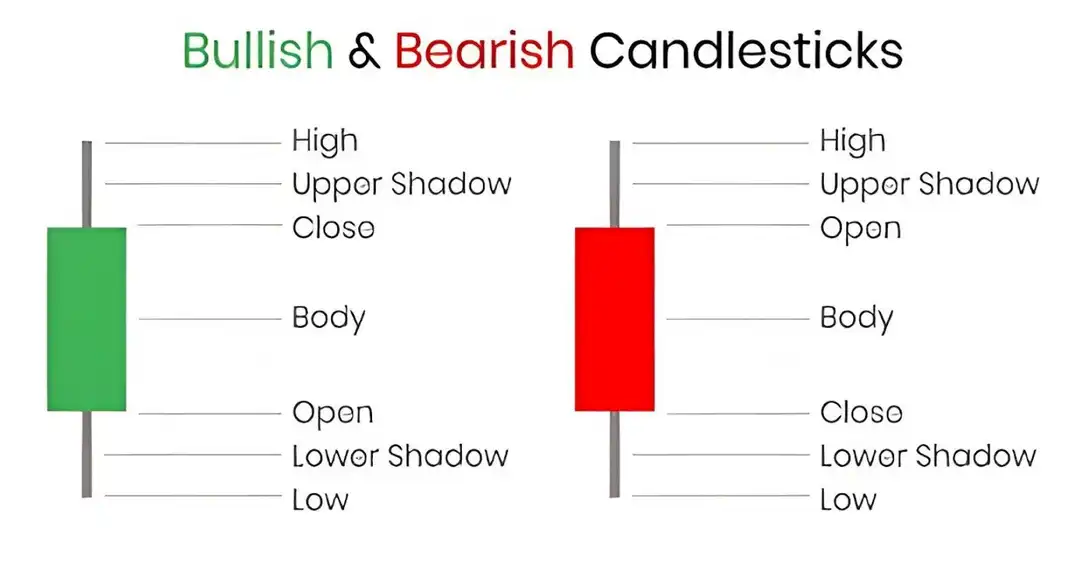
Bullish Candlestick (Typically Green or White): Indicates that the closing price was higher than the opening price. Buyers were dominant during this period.
Bearish Candlestick (Typically Red or Black): Indicates that the closing price was lower than the opening price. Sellers were dominant during this period.
The Wicks (Shadows or Tails): These are thin lines extending above and below the body. They represent the highest and lowest prices reached during the timeframe.
Upper Wick: Extends from the top of the body to the highest price.
Lower Wick: Extends from the bottom of the body to the lowest price.
Interpreting Candlestick Signals
The size and shape of the candlestick’s body and wicks provide valuable clues about the battle between buyers and sellers:
Long Body: A long bullish body suggests strong buying pressure, indicating a significant price increase during the period. Conversely, a long bearish body suggests strong selling pressure and a significant price decrease.
Short Body: A short body indicates that the opening and closing prices were very close, suggesting indecision or a period of consolidation in the market.
Long Upper Wick: This indicates that buyers pushed the price higher during the period, but sellers ultimately managed to bring the price back down before the close. A very long upper wick on a bullish candle could signal potential selling pressure.
Long Lower Wick: This indicates that sellers initially pushed the price lower, but buyers stepped in and drove the price back up before the close. A very long lower wick on a bearish candle could signal potential buying pressure.
No Wicks (Marubozu):
Bullish Marubozu: A long green body with no wicks suggests strong buying pressure throughout the entire period. The open was the low, and the close was the high.
Bearish Marubozu: A long red body with no wicks suggests strong selling pressure throughout the entire period. The open was the high, and the close was the low.
Common Candlestick Patterns
While individual candlesticks provide insights, recognizing patterns formed by multiple candlesticks can offer even stronger signals about potential trend reversals or continuations. Here are some common patterns:
Single Candlestick Patterns:
Doji: Characterized by a very small or non-existent body, meaning the open and close prices were almost the same. It often indicates indecision in the market. The significance of a Doji can depend on the preceding price action.
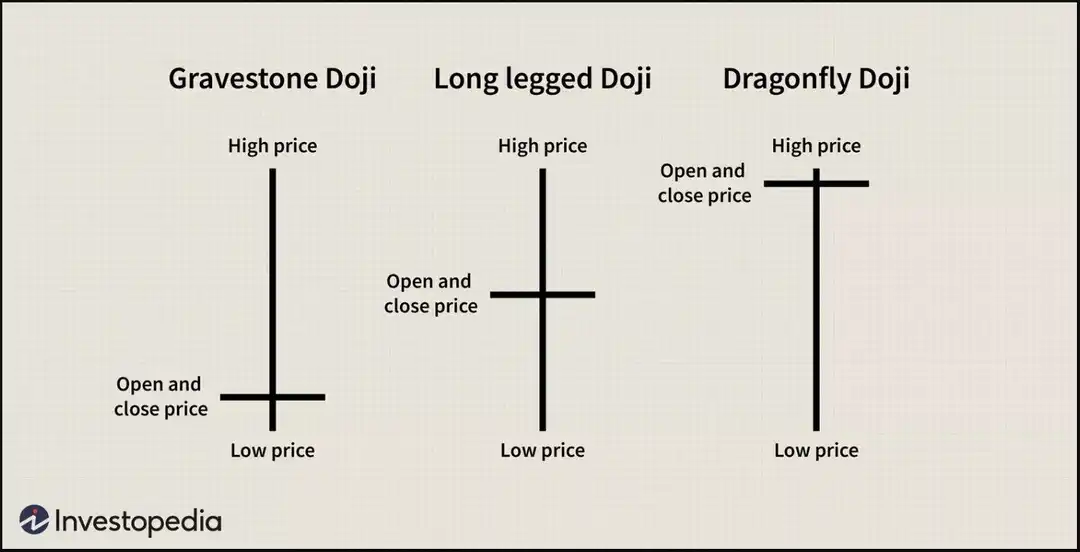
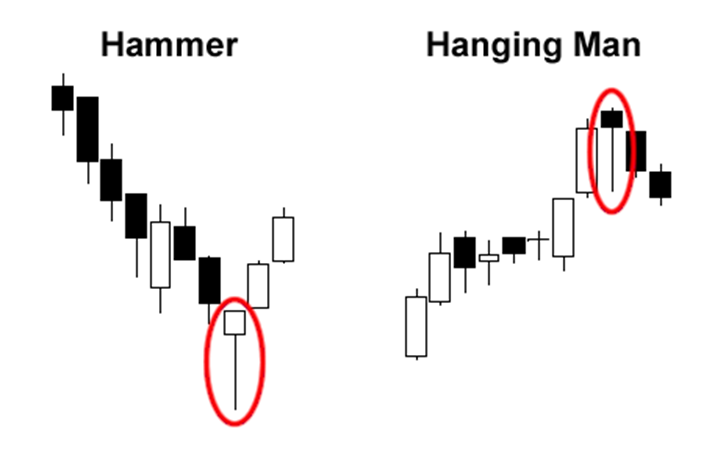
Hammer: A bullish reversal pattern found at the bottom of a downtrend. It has a small body near the high and a long lower wick, suggesting buyers overcame selling pressure.
Hanging Man: A bearish reversal pattern found at the top of an uptrend. It looks identical to a hammer but its context is crucial. It suggests that selling pressure is starting to emerge.
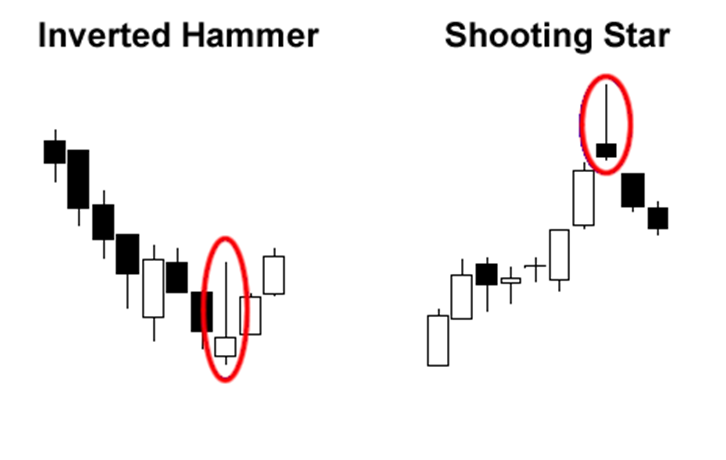
Inverted Hammer: A bullish reversal pattern found at the bottom of a downtrend. It has a small body near the low and a long upper wick, indicating buyers tried to push the price higher.
Shooting Star: A bearish reversal pattern found at the top of an uptrend. It looks like an inverted hammer but its context is crucial. It signals that sellers are starting to take control.
Multiple Candlestick Patterns:
Engulfing Pattern (Bullish & Bearish):
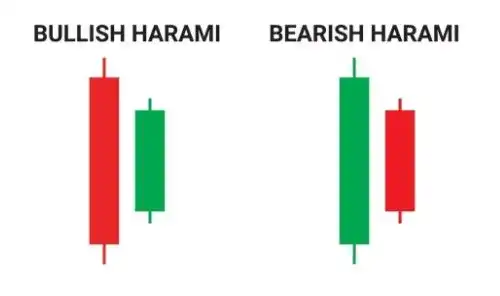
Bullish Engulfing: A bullish reversal pattern where a green candlestick completely engulfs the previous red candlestick.
Bearish Engulfing: A bearish reversal pattern where a red candlestick completely engulfs the previous green candlestick.
Piercing Line: A bullish reversal pattern where a green candlestick opens lower than the previous red candlestick’s close but closes more than halfway into the previous candlestick’s body.
Dark Cloud Cover: A bearish reversal pattern where a red candlestick opens higher than the previous green candlestick’s close but closes more than halfway into the previous candlestick’s body.

Morning Star: A bullish reversal pattern consisting of three candlesticks: a long red candlestick, a small-bodied candlestick (often a Doji) showing indecision, and a long green candlestick that closes significantly into the first candlestick’s body.
Evening Star: A bearish reversal pattern consisting of three candlesticks: a long green candlestick, a small-bodied candlestick (often a Doji) showing indecision, and a long red candlestick that closes significantly into the first candlestick’s body.

Important Considerations:
Volume: Always consider the trading volume alongside candlestick patterns. High volume during pattern formation strengthens the signal.
Timeframe: The reliability of candlestick patterns can vary depending on the timeframe. Longer timeframes generally provide stronger signals.
Context: Never analyze candlestick patterns in isolation. Consider the overall market trend, support and resistance levels, and other technical indicators.
Confirmation: It’s often wise to wait for confirmation of a candlestick pattern with subsequent price action before making a trading decision.
Putting it All Together
Learning to read candlestick charts is a crucial skill for navigating the cryptocurrency markets. By understanding the anatomy of individual candlesticks and recognizing common patterns, you can gain valuable insights into market sentiment and potential price movements. Remember to practice, observe, and combine candlestick analysis with other technical and fundamental analysis tools for more informed trading decisions.
Disclaimer: Candlestick chart analysis is a powerful tool, but it is not foolproof. Cryptocurrency markets are volatile, and past performance is not indicative of future results. Always do your own research and risk management before making any investment decisions.
Ready to start your Bitcoin journey? Sign up for OKX, Binance, or Bitget today and take your first step into the world of cryptocurrency!
